VCE · Topic explainer
Reading the gradient of a photoelectric-effect graph
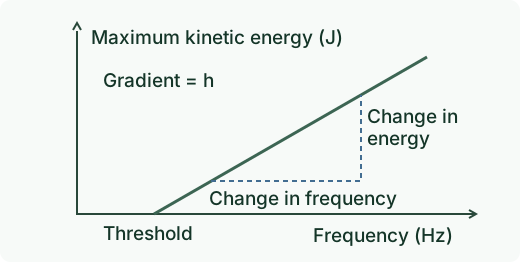
For a graph of maximum electron kinetic energy in joules against light frequency in hertz, the gradient is Planck’s constant. The horizontal intercept is the threshold frequency. Check the axes first because a stopping-voltage graph or energy measured in electronvolts changes the gradient’s units and numerical value.
Worked example
Suppose a straight line rises from 1.0 × 10⁻¹⁹ J at 6.0 × 10¹⁴ Hz to 3.0 × 10⁻¹⁹ J at 9.0 × 10¹⁴ Hz. The rise is 2.0 × 10⁻¹⁹ J over 3.0 × 10¹⁴ Hz.
The gradient is about 6.7 × 10⁻³⁴ J s. If your graph plots the magnitude of stopping voltage instead, its gradient is h/e. Multiply that voltage gradient by the elementary charge to recover h in joule-seconds.
Official exam practice
Find other years and marking guidance in the Physics official exam archive.