HSC · Topic explainer
How to interpret the slope of a regression line
The slope of a regression line is the predicted change in the response variable for each one-unit increase in the explanatory variable. State both units and identify both variables. The intercept is the predicted response when the explanatory variable is zero. Its practical meaning depends on whether zero makes sense in context.
Worked example
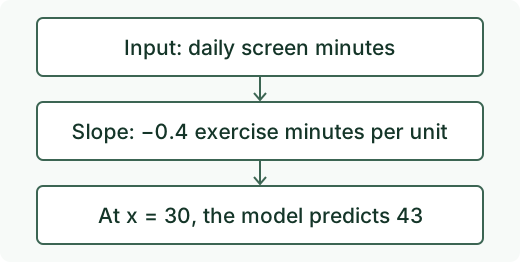
Suppose predicted daily exercise minutes equal 55 − 0.4 × daily screen minutes. For every additional minute of screen time, the model predicts 0.4 fewer minutes of exercise per day.
At 30 minutes of screen time, the prediction is 55 − 12 = 43 exercise minutes. The intercept predicts 55 at zero screen minutes. If the sample contained nobody near zero, treat that interpretation cautiously. A fitted association alone cannot establish that screen time caused the change.
Official exam practice
Find other years and marking guidance in the Mathematics Standard 2 official exam archive.