HSC · Topic explainer
Comparing primary and secondary immune response graphs
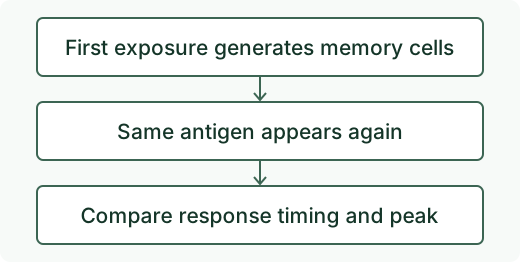
After a first exposure, a specific adaptive response takes time to develop and can generate memory cells. On later exposure to the same antigen, those cells can respond more rapidly. In a graph of antibody concentration, compare the delay, peak and time course using the values or trends shown.
Worked example
Suppose a graph shows detectable antibodies after eight days on first exposure and after three days on second exposure. Describe the second response as starting five days earlier in this example.
If the second peak is also higher, describe that as a separate observation. Link the differences to memory cells generated during the first response and activated on re-exposure. Use the graph to support the comparison before explaining the mechanism.
Official exam practice
Find other years and marking guidance in the Biology official exam archive.