HSC · Topic explainer
How do you calculate the gradient of a graph?
Gradient measures the change in the vertical variable per unit change in the horizontal variable. Pick two points and divide the change in y by the change in x. For an experimental straight-line fit, use points on the fitted line. The units come from the vertical axis divided by the horizontal axis.
Worked example
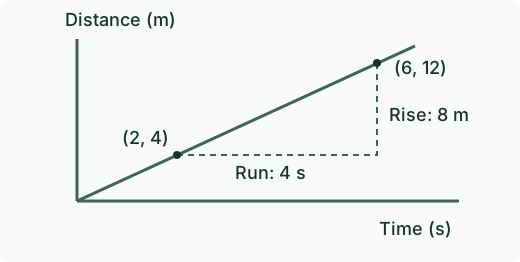
A distance–time line passes through (2 s, 4 m) and (6 s, 12 m). The rise is 12 − 4 = 8 m and the run is 6 − 2 = 4 s. The gradient is 2 m/s.
Read the axis scales and units before subtracting. Reversing the point order in both differences gives the same gradient. A falling line has a negative gradient, and a vertical line has an undefined gradient because the horizontal change is zero.
Official exam practice
Find other years and marking guidance in the Investigating Science official exam archive.